Corded vs Cordless Fleet Cost: TCO Analysis
By Diego Santana • 15th Feb
When you're managing a contractor fleet vacuum comparison or a janitorial crew, the choice between corded and cordless models rarely comes down to single-day performance. It comes down to what happens over 18 months, 36 months, and across five machines instead of one. Measuring ports, mapping adapters, then nothing surprises on-site (that principle applies to fleet budgeting too).
Most facility managers and trade crews see a corded vs cordless fleet cost decision as a binary: cordless looks modern and mobile, corded feels industrial and durable. But that framing misses the real math. Downtime, battery replacement costs, infrastructure strain, and what actually gets cleaned week-to-week reshape the numbers in ways a spec sheet won't show. For a side-by-side view of real performance, see our corded vs cordless runtime and power test.
Let me walk you through the framework I use to audit total cost of ownership (TCO) for contractors and facility teams. This isn't theory. It's what I've mapped after inheriting four different vacuums with drawers of mismatched adapters and realizing that standardizing on interface first paid for itself in weeks.
Step 1: Establish Your Runtime Baseline and Downtime Window
Start by documenting what your crew actually does in a typical week. Not what the vendor promises; what happens on Tuesday morning when three rooms need vacuuming before occupants arrive, or when two sanders run simultaneously on a remodel site.
Corded vacuums deliver unlimited runtime provided an outlet exists nearby. For facility cleaning teams working in multi-floor offices, hospitals, or deep-cleaning residential jobs, this translates to continuous suction across entire sessions without stopping to swap batteries.
Cordless models (backpack or upright) typically manage 45 minutes to 90 minutes per charge. If your cleaning cycle requires three hours of sustained suction without interruption, a cordless unit demands battery swaps and charging intervals. That idle time (waiting for a charge, swapping packs, retrieving a charged unit) becomes an invisible cost the moment you count labor hours.
Action step: Log actual cleaning time across three weeks. Document how many sessions require sub-one-hour runs versus extended stretches. If 60% of your work fits in 45-minute windows, cordless downtime may be acceptable. If 60% exceeds 90 minutes, corded runtime eliminates a chronic frustration.
Step 2: Map Charging Infrastructure and Battery Lifecycle Costs
Cordless fleets demand charging stations. Budget for outlet placement, potential electrical upgrades, and charging station hardware if you're managing 4-6 units with staggered shifts.
Then calculate battery replacement costs. Cordless vacuums typically use lithium or NiMH packs rated for 300-500 charge cycles before capacity drops noticeably. If a replacement battery costs $150-400 per unit and you own six cordless machines, expect to replace packs every 18-24 months per device. Over a five-year span, that's two full replacements per machine: $1,800-$4,800 per unit, or $10,800-$28,800 for a six-unit fleet.
Corded vacuums eliminate battery costs entirely but require cord management infrastructure: storage racks, cord protectors, and outlet-proximity job planning. That's a one-time capital cost and ongoing operational discipline (not a recurring consumable drain).
Action step: Call your preferred cordless vacuum vendor and request actual battery lifecycle data for your region's climate and usage pattern. Request quotes for replacement packs and warranty terms. Cross-check against corded outlet costs at your key sites (facility address, truck placement, outdoor washout zones).
Step 3: Compare Suction Power Consistency and Filter Clogging Reality
Corded vacuums maintain consistent suction power throughout a session because they draw from continuous electrical current. Typical suction ranges from 250-400 AW (air watts), remaining steady for hours.
Cordless units often start strong but suction degrades as battery charge depletes. Most models rated 100-300+ AW deliver peak power in the first 20-30 minutes, then drop as voltage sags. For heavy debris (drywall dust, concrete), this degradation compounds filter clogging: lower suction means dust builds faster on the filter, restricting airflow further.
When suction drops, cleaners either swap machines mid-job or work with compromised performance, stretching cleanup time and potentially re-cleaning areas later. That's hidden labor cost.
Action step: Run a paired test: use a corded and cordless unit on identical messes (drywall rooms, concrete sweeps) and time actual cleanup per 1,000 sq ft. Document suction loss in cordless units after 30, 60, and 90 minutes using an inexpensive suction gauge (Home Depot, ~$25). If cordless suction drops >15% by minute 60, factor that slowdown into your per-job labor estimate.
Step 4: Evaluate Maintenance Schedules and Replacement Part Availability
Corded vacuums typically have lower maintenance burden: no battery monitoring, no charge-cycle logging, no pack replacement logistics. Routine care focuses on filter cleaning, dust bin emptying, and occasional cord inspection. Parts are often standardized and widely available.
Cordless fleets demand battery health tracking, charger reliability, and supply-chain agility for pack replacements. If a battery fails mid-shift and backup packs are delayed, a crew sits idle. If a charger malfunctions, the entire battery-dependent shift stalls.
Additionally, corded vacuums often include larger dust bins (reducing trips to trash) and easier filter access than some compact cordless designs. Easier maintenance means faster turnover between jobs and less downtime friction.
Action step: Request maintenance schedules and parts catalogs from vendors. Ask: What is the typical failure rate for batteries and chargers? How long are replacement lead times? Do they stock parts locally or require mail order? Map that against your crew's tolerance for unscheduled downtime.
Step 5: Calculate Labor Cost Impact of Mobility vs. Unlimited Runtime
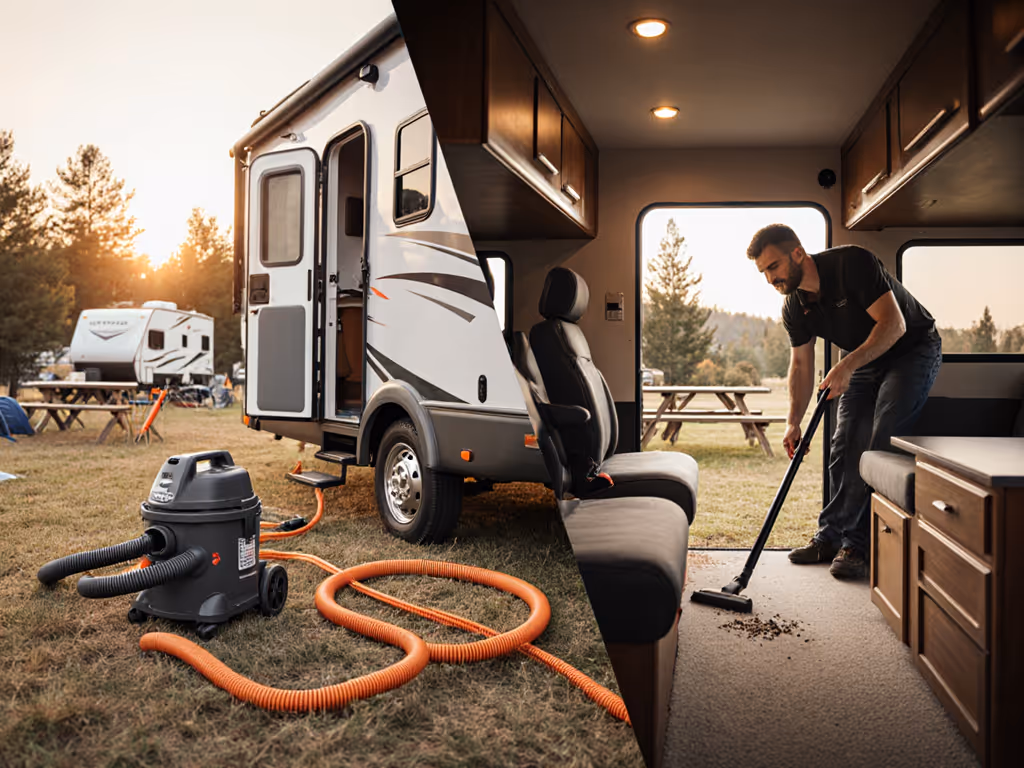
Cordless excels where mobility is the bottleneck: navigating dense furniture, climbing stairs without dragging a cord, working in spaces where outlet placement forces awkward cord routing. Mobile detailing, tight residential remodels, and multi-story offices where outlet strategy is chaotic all favor cordless simplicity.
Corded suits long-duration, fixed-zone work: warehouse cleaning, construction sites with centralized power, facility deep cleaning, and multi-room residential jobs where a single outlet placement solves the whole session.
The hidden variable is labor efficiency per dollar spent. If cordless mobility saves 20 minutes per 8-hour shift but costs an extra $5,000 per unit over five years, that's $0.50/hour saved against $1,000/year battery overhead. If corded outlet management costs 10 minutes per 8-hour shift but eliminates battery expenses, you're paying zero battery dollars for a ten-minute inconvenience.
Action step: Estimate your crew's hourly labor burden (wages + taxes + overhead). Quantify time lost to cord routing, battery swaps, and charging delays across a typical week. Multiply by your labor rate. Compare that annual labor cost to the five-year battery and infrastructure cost for each model type. The highest number usually reveals your operational friction point.
Step 6: Factor in Downtime Metrics and Redundancy Costs
Fleets should never rely on a single unit. When one fails, crew standby cost balloons instantly.
Corded fleets often justify 5-6 units for a 4-5 person crew because machines are inexpensive enough to hold spares and because downtime repair is simpler: cord replacement, motor bearing service, or filter swap happen onsite or overnight at a local shop.
Cordless fleets often run 1 unit per crew member plus one spare, because units cost more and battery repairs may require vendor turnaround. If a battery fails and backup packs are depleted, the crew loses that machine for days while packs recharge or replacements ship.
That downtime risk translates to project delays, client friction, and crew reassignment chaos. Some facilities budget 15-20% redundancy (extra machines idle, waiting for failures) just to avoid single-point-of-failure scenarios.
Action step: Define your crew size and typical daily deployment. Model scenarios: What happens if Machine A fails? How fast can it be repaired? Do you own enough backup units to absorb the loss? For cordless, add three days to repair estimate (battery sourcing, testing, installation). For corded, assume one day. Calculate the labor cost of crew idle time and multiply by your daily average task value. That becomes your downtime risk baseline.
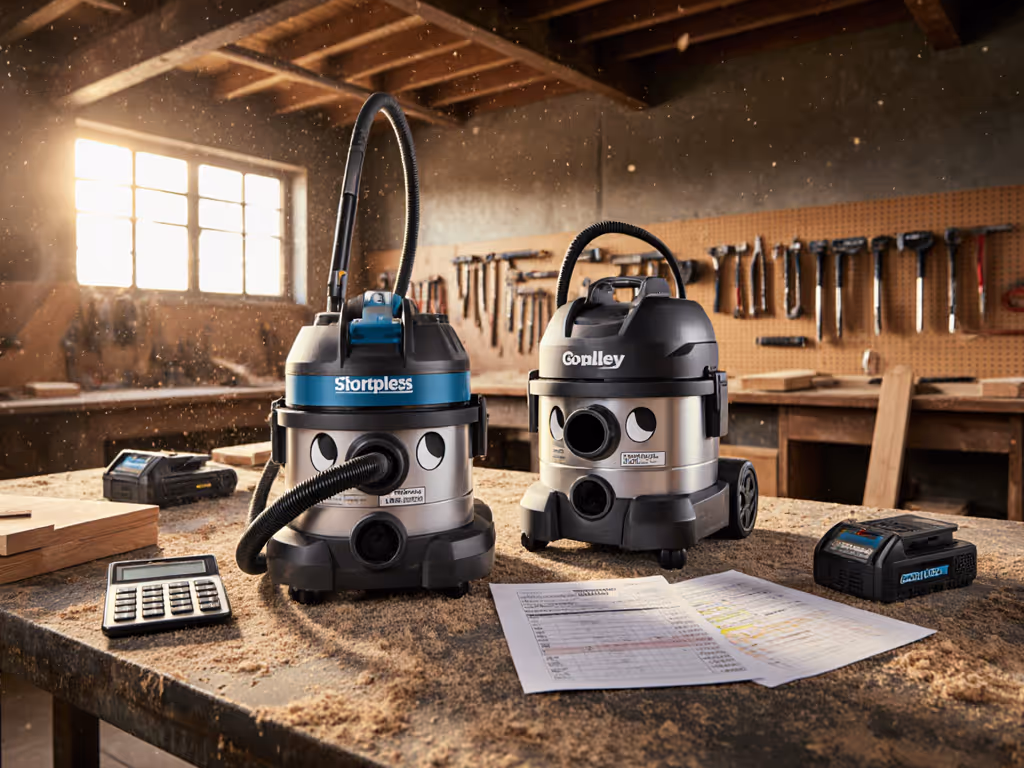
Step 7: Project Five-Year TCO and Model Scenarios
Now assemble the numbers:
Corded Fleet (6 units, $2,500 per unit, five-year horizon):
- Initial capital: $15,000
- Replacement hose/cord kits (every 18 months): $600
- Outlet upgrades and management infrastructure: $1,200
- Filters, bags, maintenance (annual): $800 × 5 years = $4,000
- Repair labor (localized, rapid): $1,500 over five years
- Five-year total: ~$22,300
- Per-machine annual cost: ~$744
Cordless Fleet (6 units, $3,200 per unit, five-year horizon):
- Initial capital: $19,200
- Battery replacements (two full sets per machine, $250/pack): $3,000
- Charger replacements and station setup: $1,500
- Filters, bags, maintenance (annual): $700 × 5 years = $3,500
- Repair labor (battery diagnostics, longer lead times): $2,200
- Downtime cost (estimated 40 hours/year lost to charging delays, at $35/hr labor): $7,000
- Five-year total: ~$36,400
- Per-machine annual cost: ~$1,213
These are rounded estimates, but the ratio holds for most contractor and facility scenarios: corded TCO typically runs 30-40% lower than cordless when sustained-runtime work dominates. For energy line items in your spreadsheet, use our shop vacuum wattage guide to estimate electricity costs accurately.
However, if your crew's work profile is 80% short-burst, high-mobility tasks, cordless downtime cost collapses, and the equation reverses.
Action step: Build a spreadsheet using your actual unit costs, local labor rates, and site-specific infrastructure needs. Run three scenarios: all corded, all cordless, and hybrid (corded for facility/warehouse, cordless for mobile detailing). The scenario with the lowest five-year number per productive hour worked is your starting position.
Step 8: Build Your Interface-First Standardization Plan
Regardless of corded or cordless choice, adapters are plan A, not plan B. Fleet performance collapses when machines, hoses, and tool ports don't align.
Before finalizing your fleet selection, audit every tool your crew owns: all sander port diameters, all power tool dust pickups, all shop equipment connections. Common contractors encounter 1¼ in, 1⅞ in, 2½ in hose ports plus metric 27, 32, and 36 mm (all on the same jobsite). See how hose length and diameter affect suction before you lock in a standard. If your fleet vac uses 2½ in inlet but half your sanders run 1⅞ in, you're either buying expensive multi-step adapters or losing suction with loose-fit reducers that leak and clog faster.
With your core model selected (corded or cordless), specify a standardized hose kit: one diameter and length across all machines, with labeled, locking adapter rings for each tool connection. This single decision, interface first, halves your troubleshooting time and ensures every crew member pulls the same effective suction regardless of machine assignment.
Bringing the Decision Home
Corded vs. cordless fleet cost isn't a spec-sheet question. It's a labor logistics question. Document your actual runtime, downtime tolerance, and site infrastructure, then run the TCO math with real numbers from your region. That analysis, paired with standardized interface planning, ensures your fleet choice protects uptime, minimizes hidden labor costs, and supports scaling without adapter chaos. Measure ports, map adapters, then nothing surprises on-site.
Related Articles